

Problem
Coaches Lack Clear Performance Data Tools
Season stats were stored in separate spreadsheets and raw reports, making it difficult for coaches to quickly find or compare information. This slowed down their ability to evaluate players, track progress, and make data-driven decisions.
D1 Soccer Data Visuals
Simplifying Player and Team Performance Stats
Role - Researcher, Designer
Tools - Figma
Duration - 3 Months
Team - 5 Other Designers
The Solution
Interactive Visuals Simplify Team Data
The new website includes various data visualizations that organize season and player stats into clear, interactive graphics. Coaches can quickly compare metrics, track trends over time, and identify strengths and weaknesses without digging through spreadsheets.
Division 1 soccer coaches, players, and recruits rely on various tools and websites to analyze performance data, but the experience of most is fragmented and inefficient. Data and video live in separate places, stats lack context, and visuals are slow and hard to interpret.
Centralize all of the team’s data into one clear, accessible platform
Connect performance data directly to relevant clips or games for better context
Create intuitive data visualizations that support quick insights
Enable team and player comparisons to reveal long-term trends
Research
Understanding The Challenge
Goals & Objectives
Key Features
Based on direct feedback from coaches, the platform was designed around a few key features they needed most to quickly understand the overall performance of the team.
One of the most requested features from coaches was a player comparison tool, which led us to design a clean, interactive radar chart that compares key performance metrics player-by-player or team-by-team.
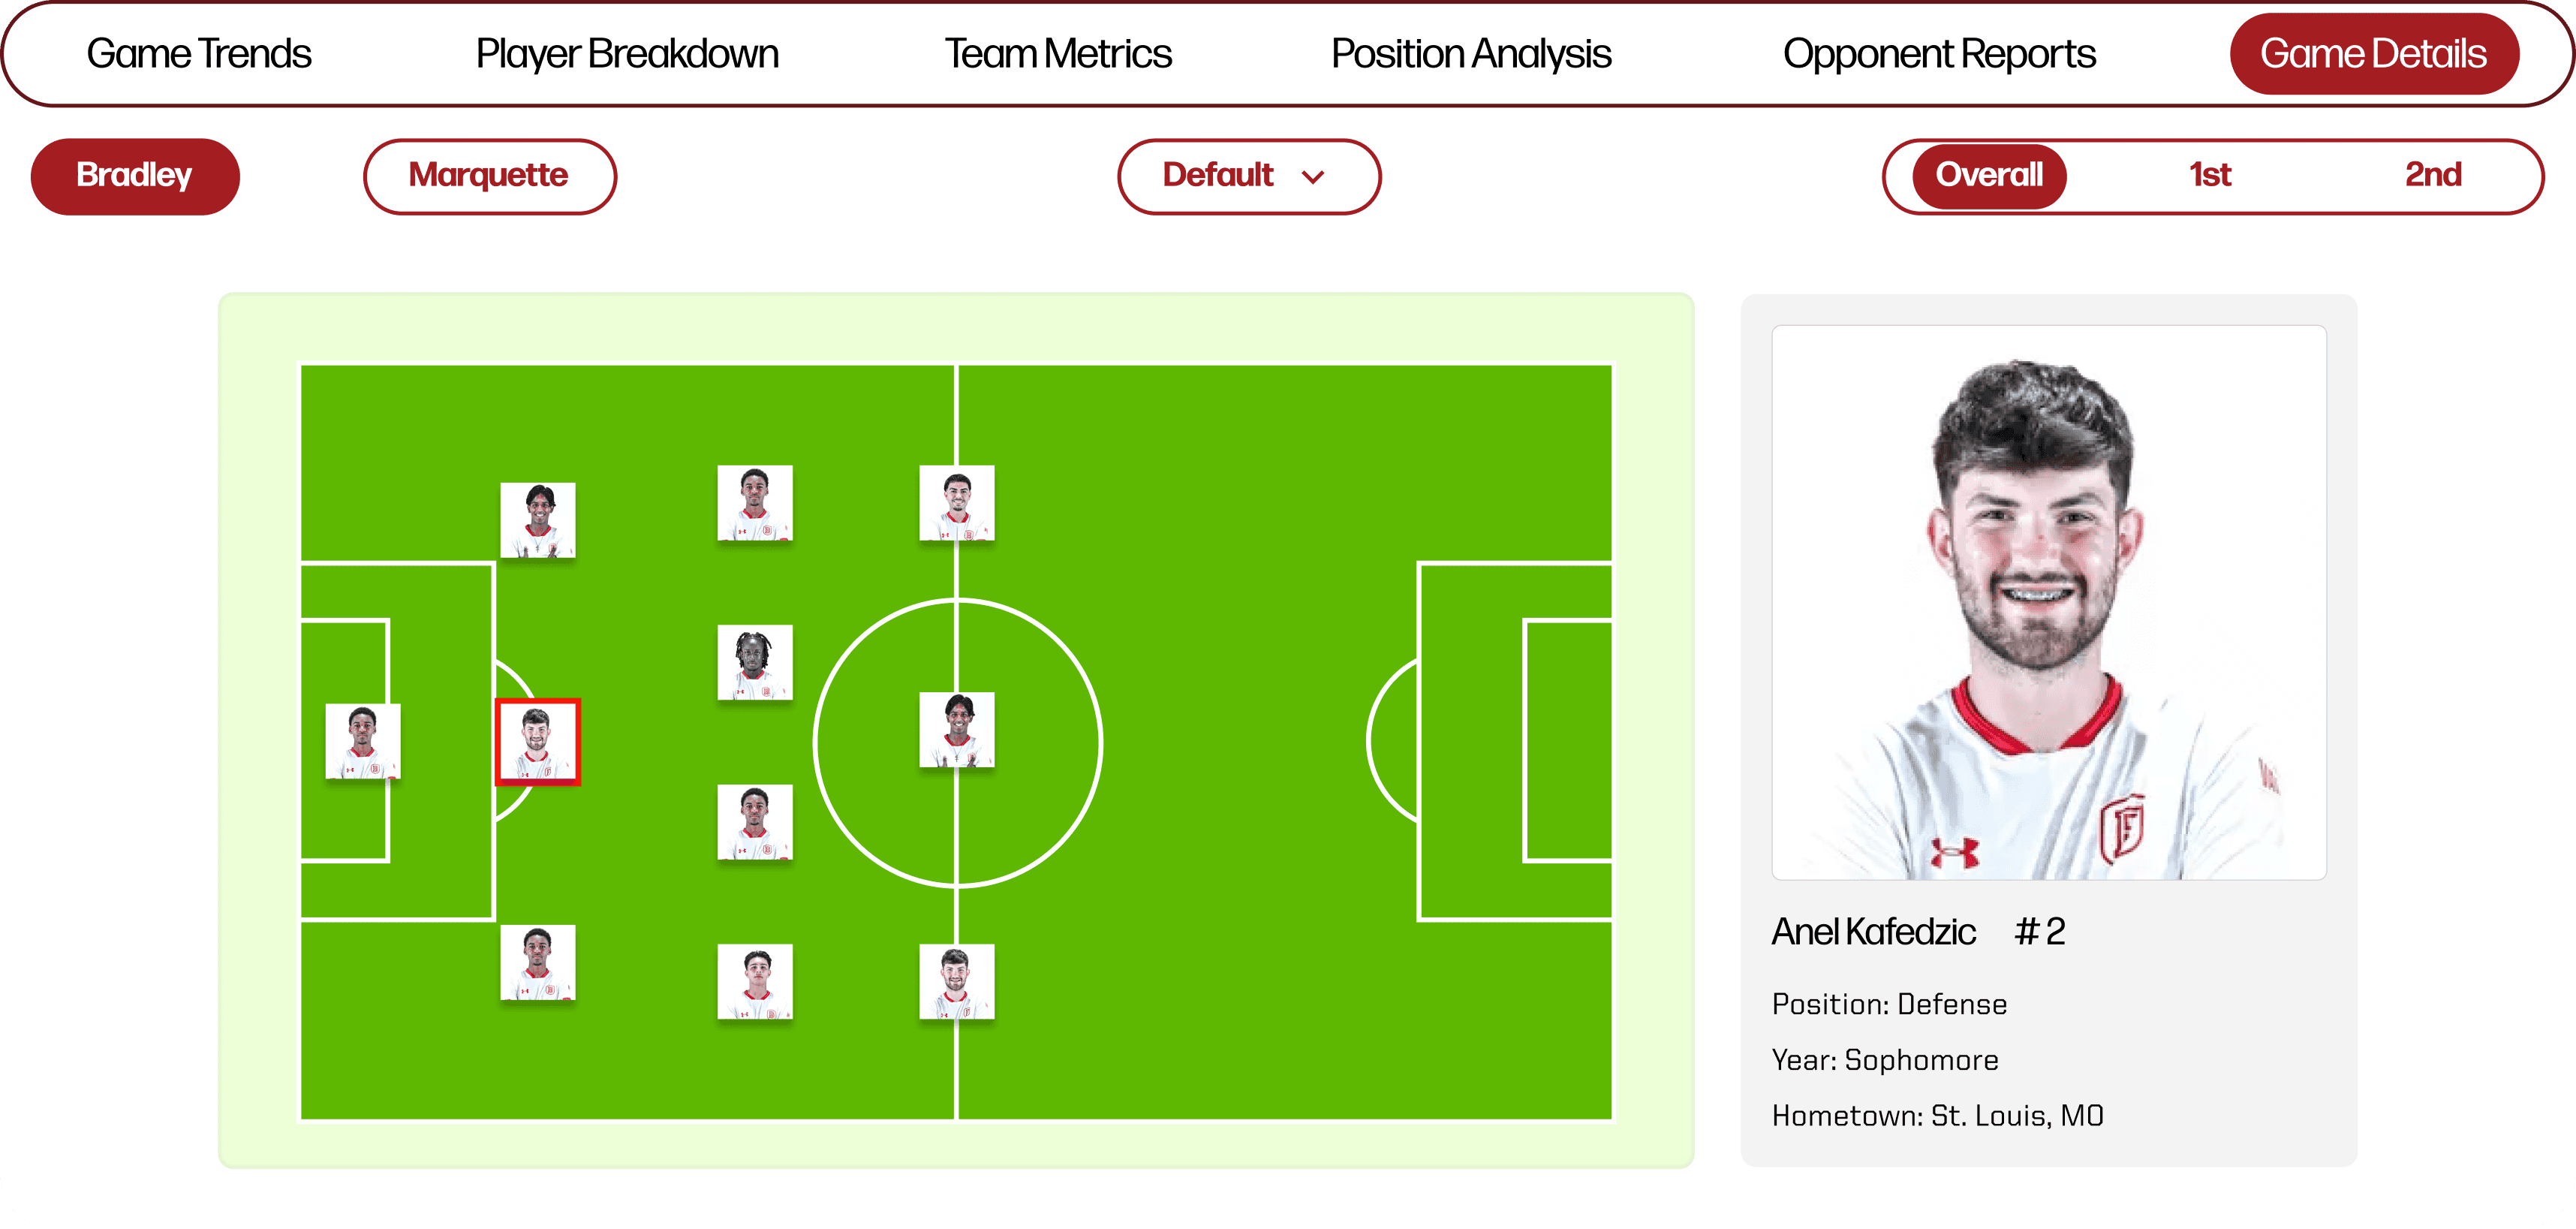
Another key feature is the game details breakdown page, which opens with the starting lineup data and then expands into deeper match insights like possession, attacking patterns, shots, and other performance metrics as needed.
50%
20%
60%
41%
80%
60%
30%
45%
77%
83%
Passes
Accurate Passes
Accurate Progressive Passes
Long Ball Ration
Fwd Ball Ration

ANEL K.
Class: Sophomore
Height: 6’3
Weight: 195
Position: Center Back
Total
0
0
0
0
0
Goals
Category (Per 90 minutes)
Shots
Head Goals
Passes to final third
Passes to penalty area
Defending
Attacking
Possesion
Player Comparison Chart
Game Details Breakdown
To better understand the challenges and needs of our users, we created multiple personas to represent coaches and players.
Persona Profiles
We analyzed five competing soccer data platforms to identify usability gaps and data visualization that informed our design decisions along the way.
Competitive Analysis
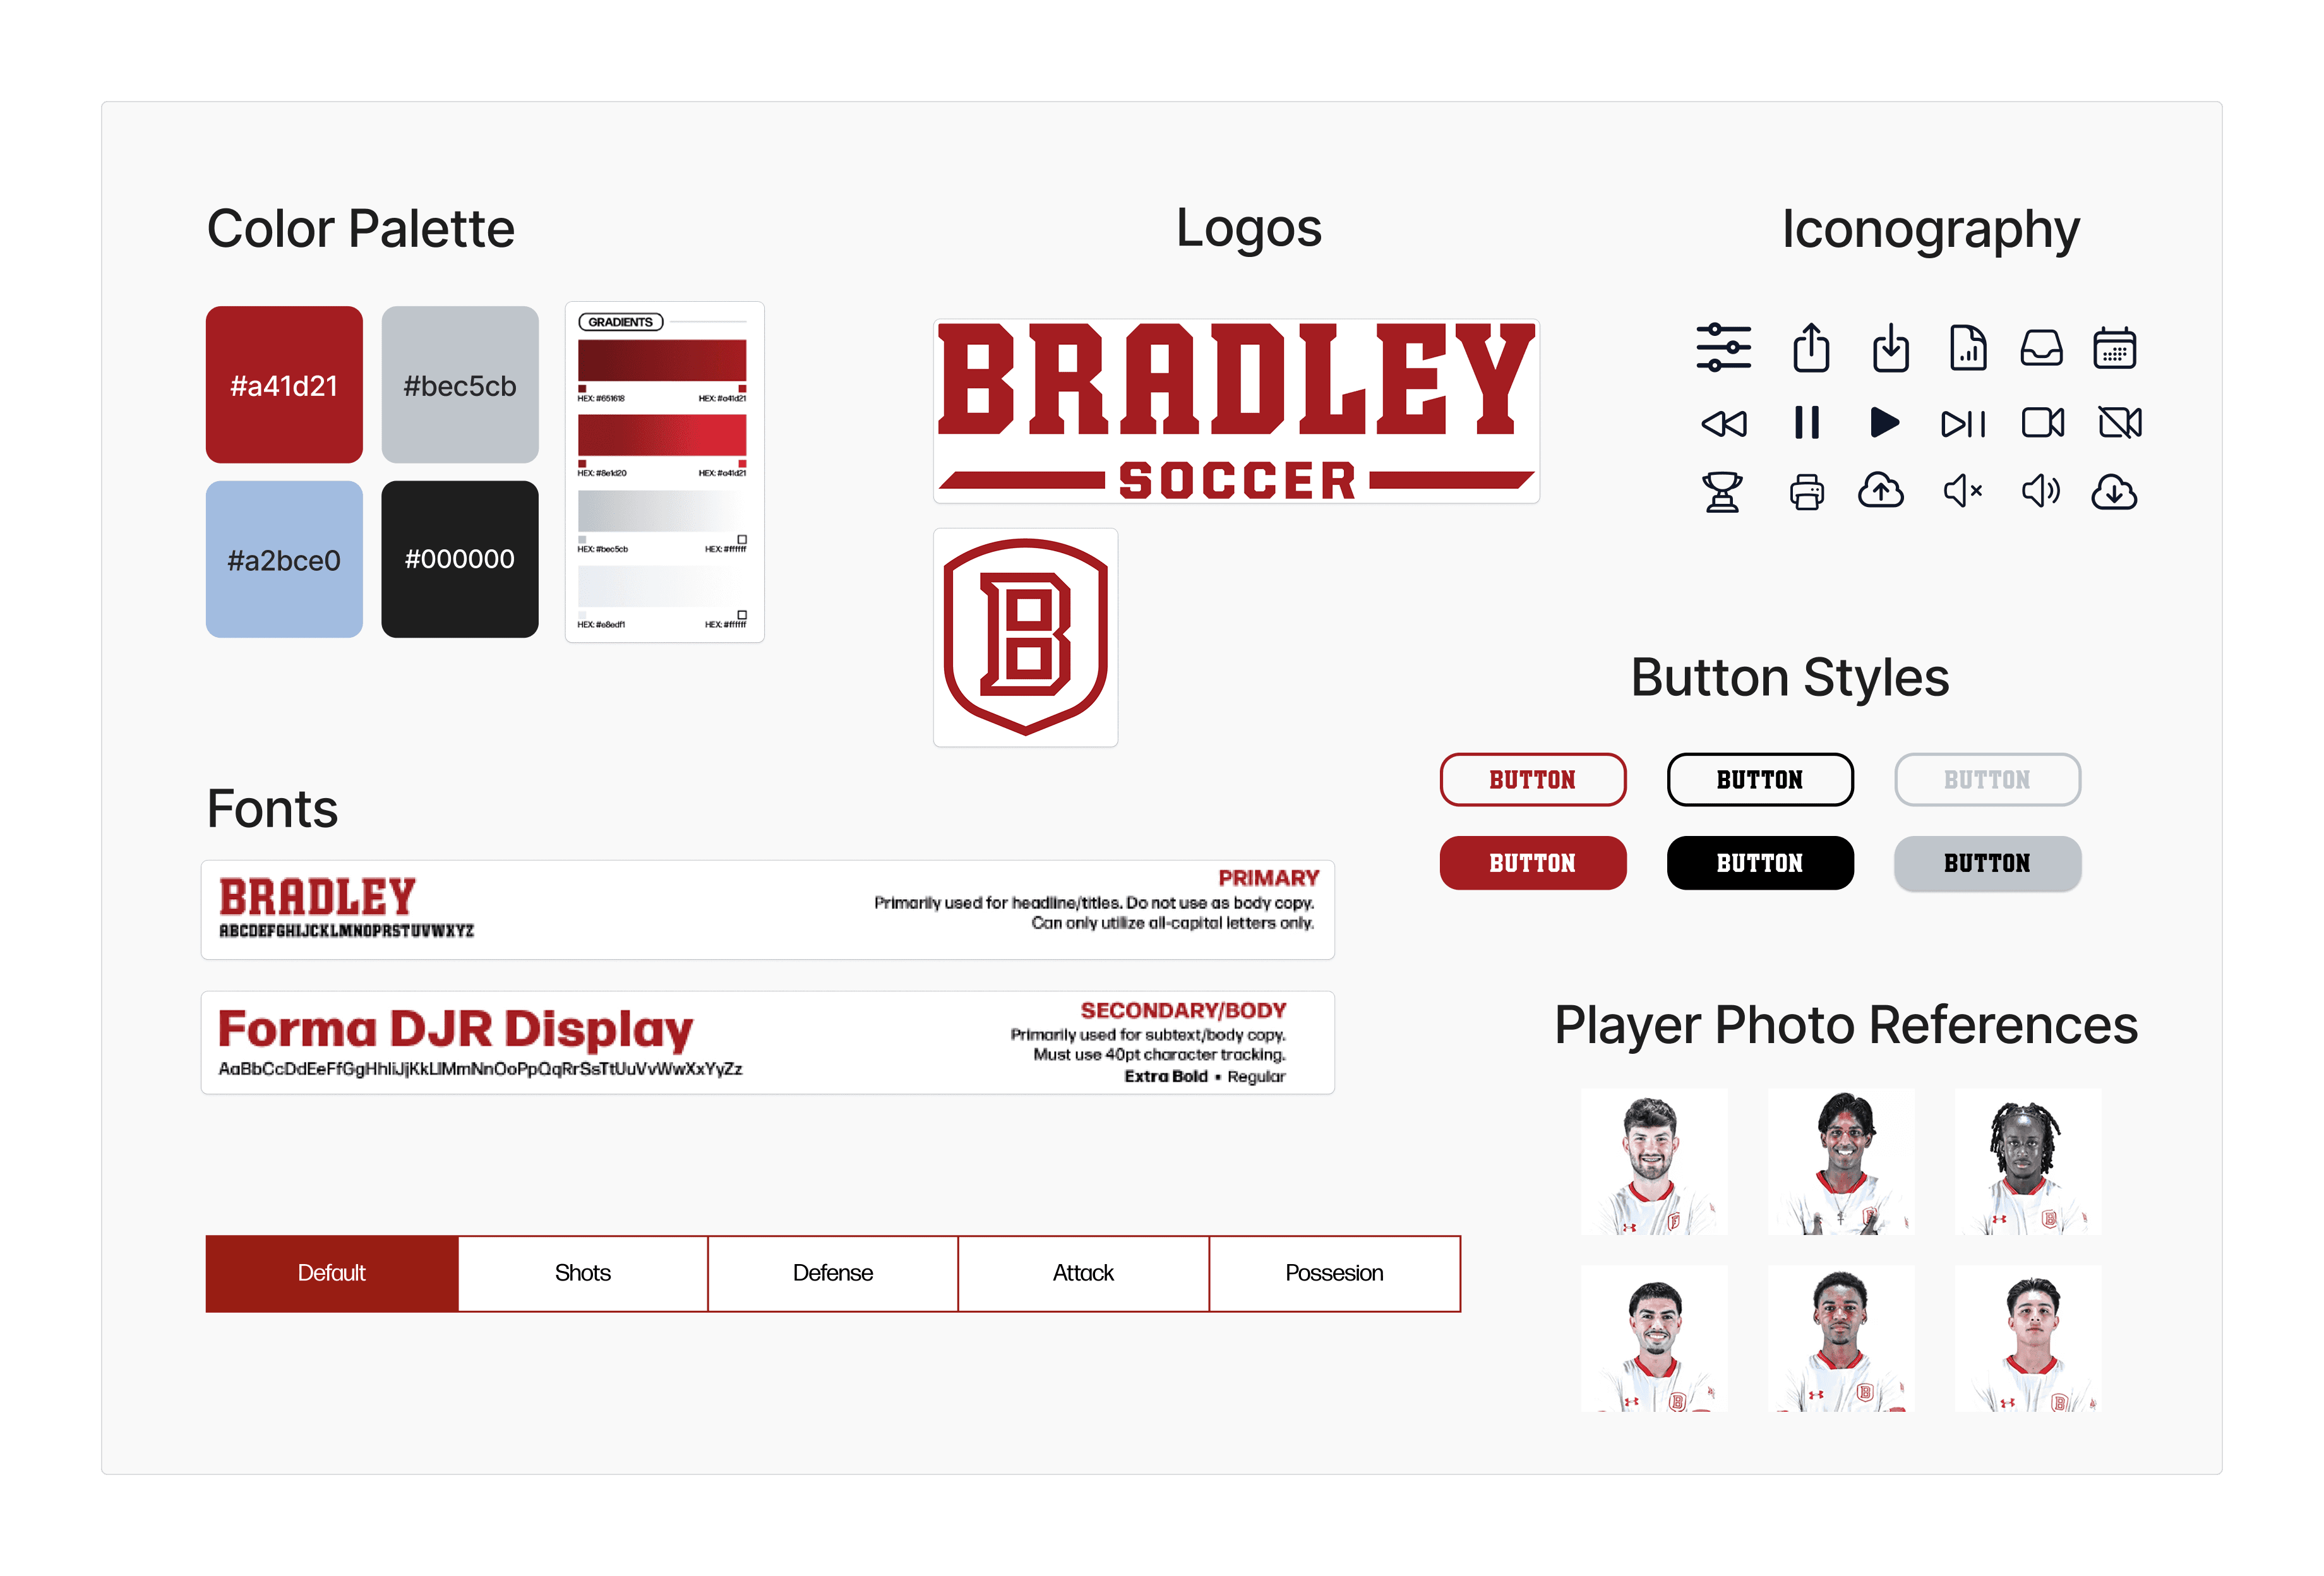
Here’s a glimpse of the style guide, where we defined colors, typography, and visual elements to ensure a consistent and polished look across the entire platform.
Style Guide
There’s a lot that went into this project—interviews, empathy maps, golden thread work, user flows, and more. Instead of overwhelming you on this page, I’ve tucked everything into a FigJam. Click below to explore the full process!
Want to See All the Research?
Below are a few of our low-fidelity data visualization wireframes, which helped us plan the layouts, hierarchy, and key functionality.
Low-Fidelity Wireframes
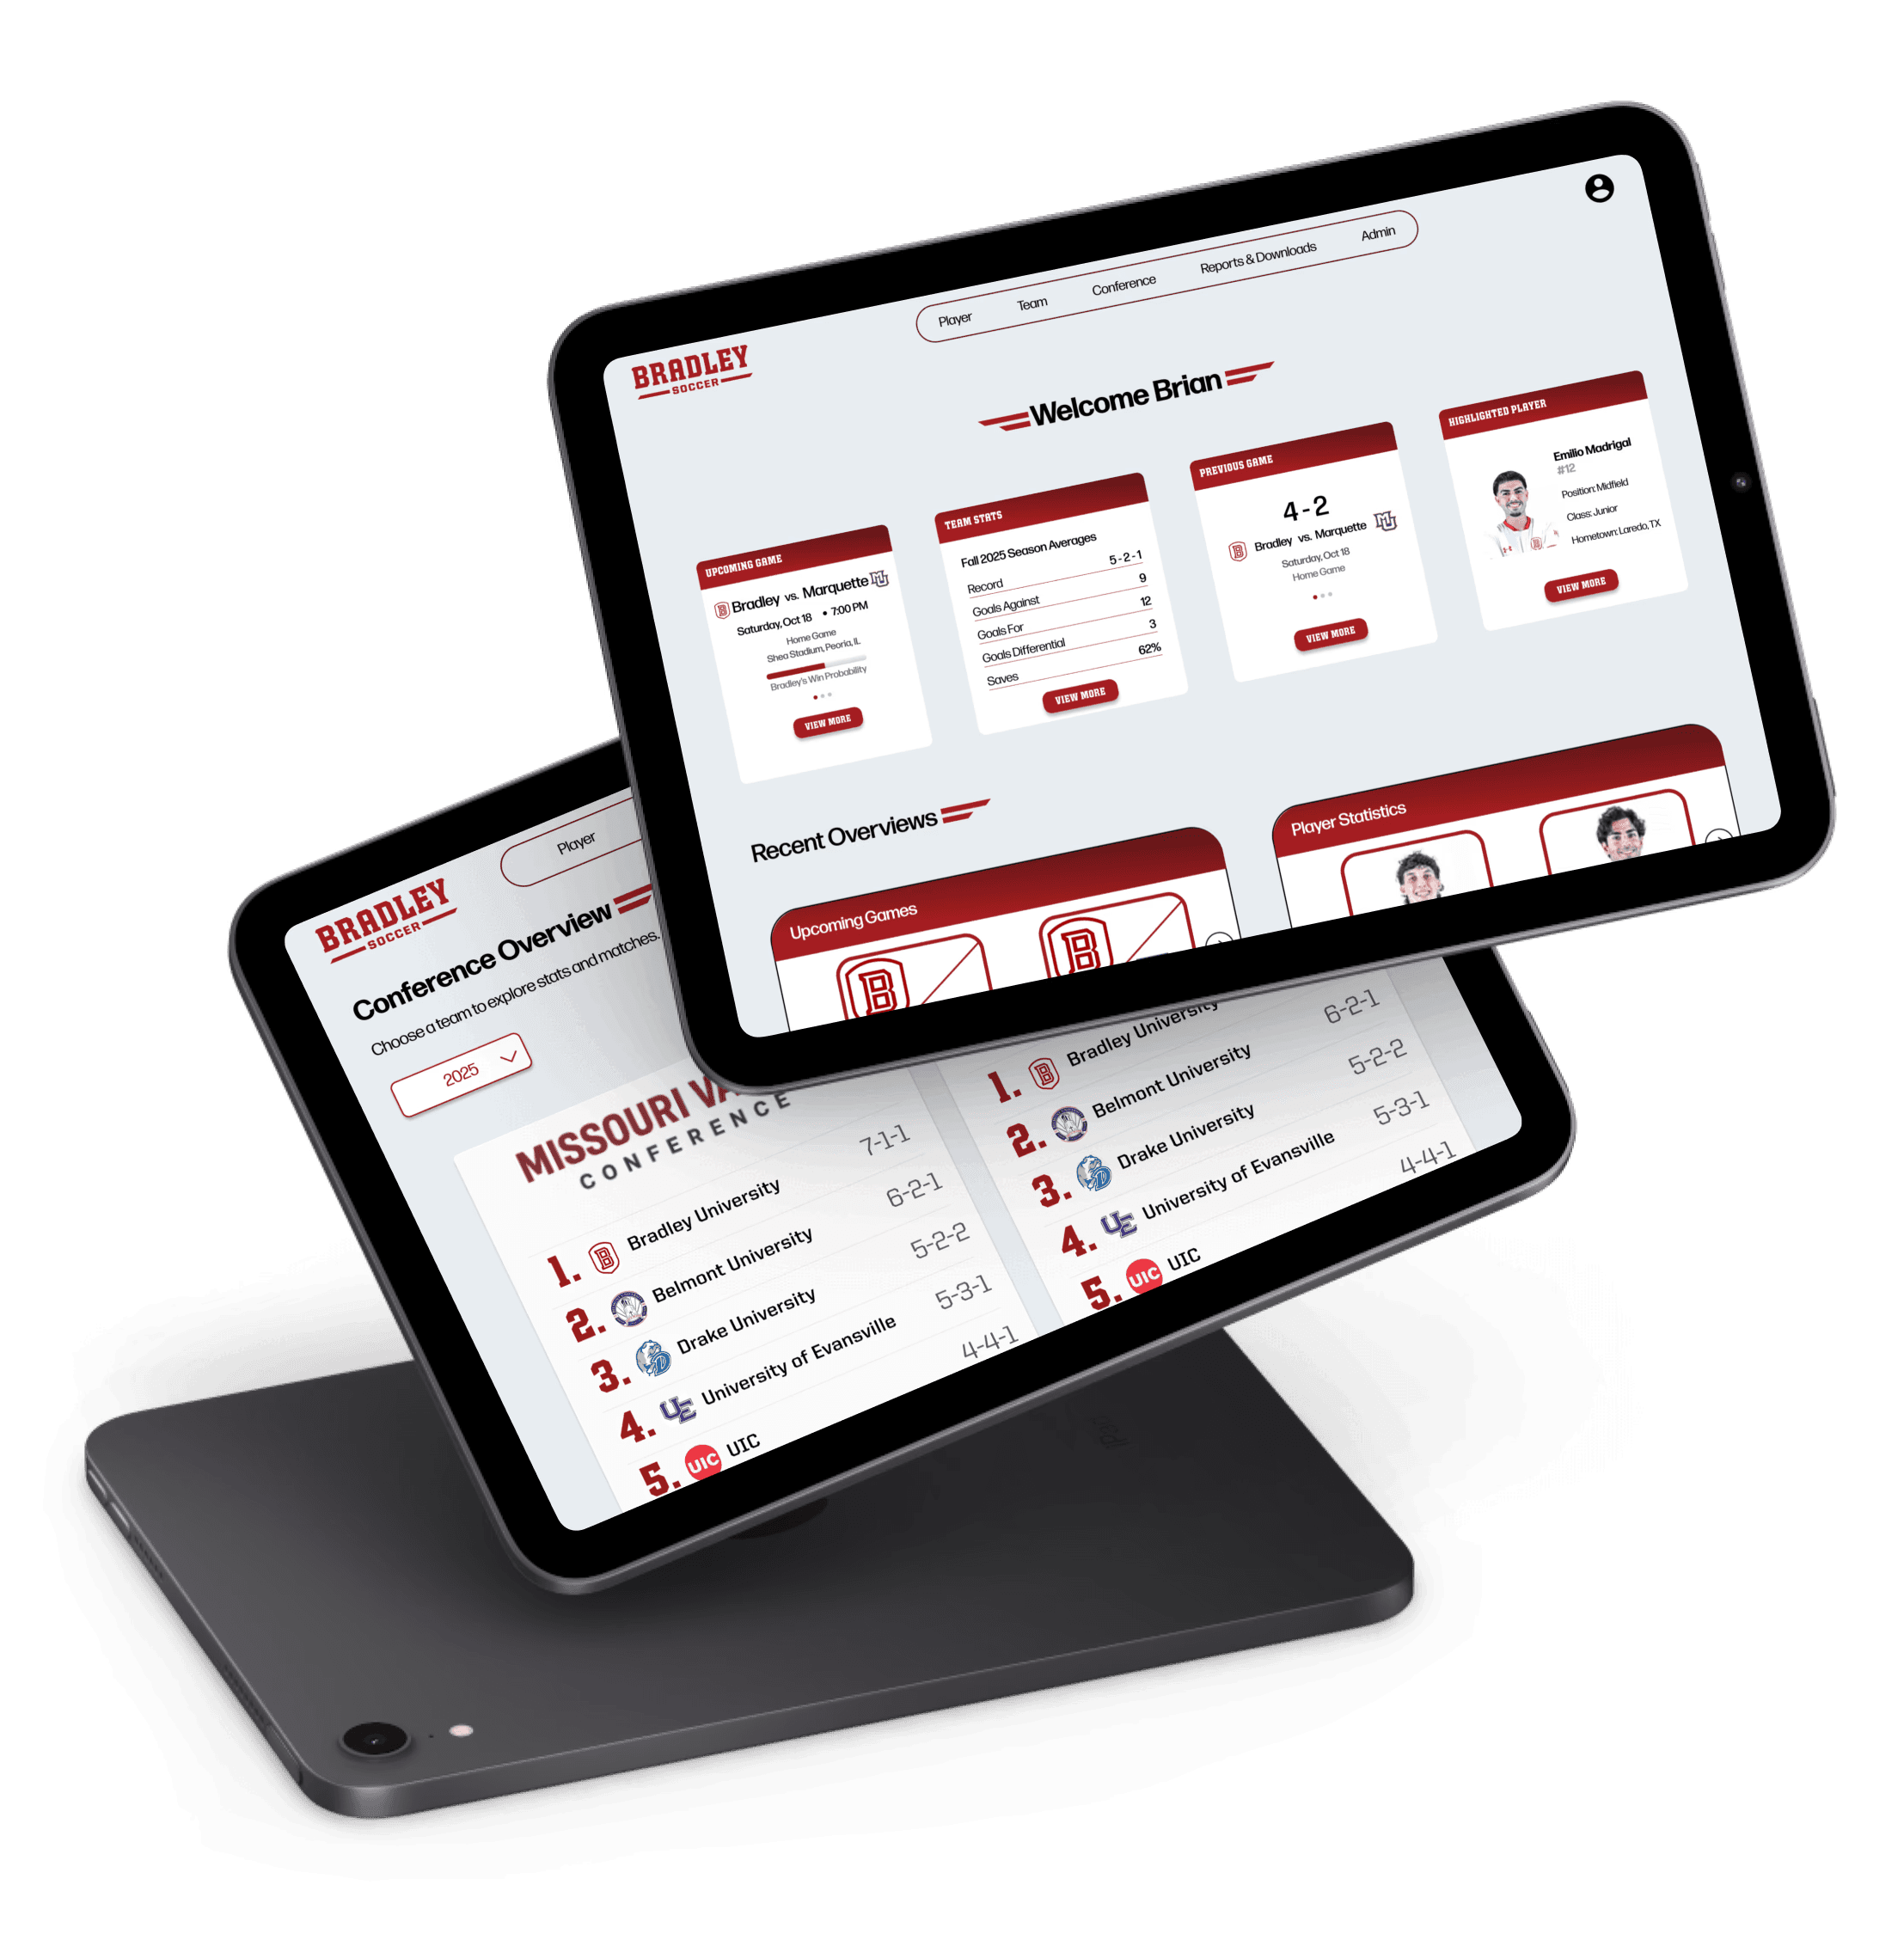
Here are a few of the final website designs, where the data visualizations and interface come together to create a cohesive and useful experience. While we didn’t create a clickable prototype, these screens were made to communicate the design and interactions for the computer science team to implement.
Final Designs
Player Overview
Upcoming Game
Button
Bradley vs. Opponent
Saturday, Oct 18
Home Game
Shea Stadium, Peoria, IL
Win Probability
7:00 PM
Project Impact
This project streamlined how Division 1 soccer coaches, players, and recruits access and interpret performance data. By connecting stats and creating intuitive, interactive visualizations, the platform makes it faster and easier to uncover insights, compare players and teams, and track trends over time. It lays the foundation for more data-driven decisions in season games and player development.
Lessons Learned & Future Development
Time Management & Prioritization: With the project condensed from a year-long timeline to just one semester, we learned how important it is to focus on core features and prioritize what provides the most value to users.
Design Handoff: Delivering polished screens instead of a full prototype emphasized the importance of clear communication with the development team to ensure our design intent translates correctly.
Future Development: The computer science team will continue building the platform, expanding it into a fully interactive tool with more data integration, advanced visualizations, and AI-driven insights for coaches, players, and recruits.
Measuring Impact

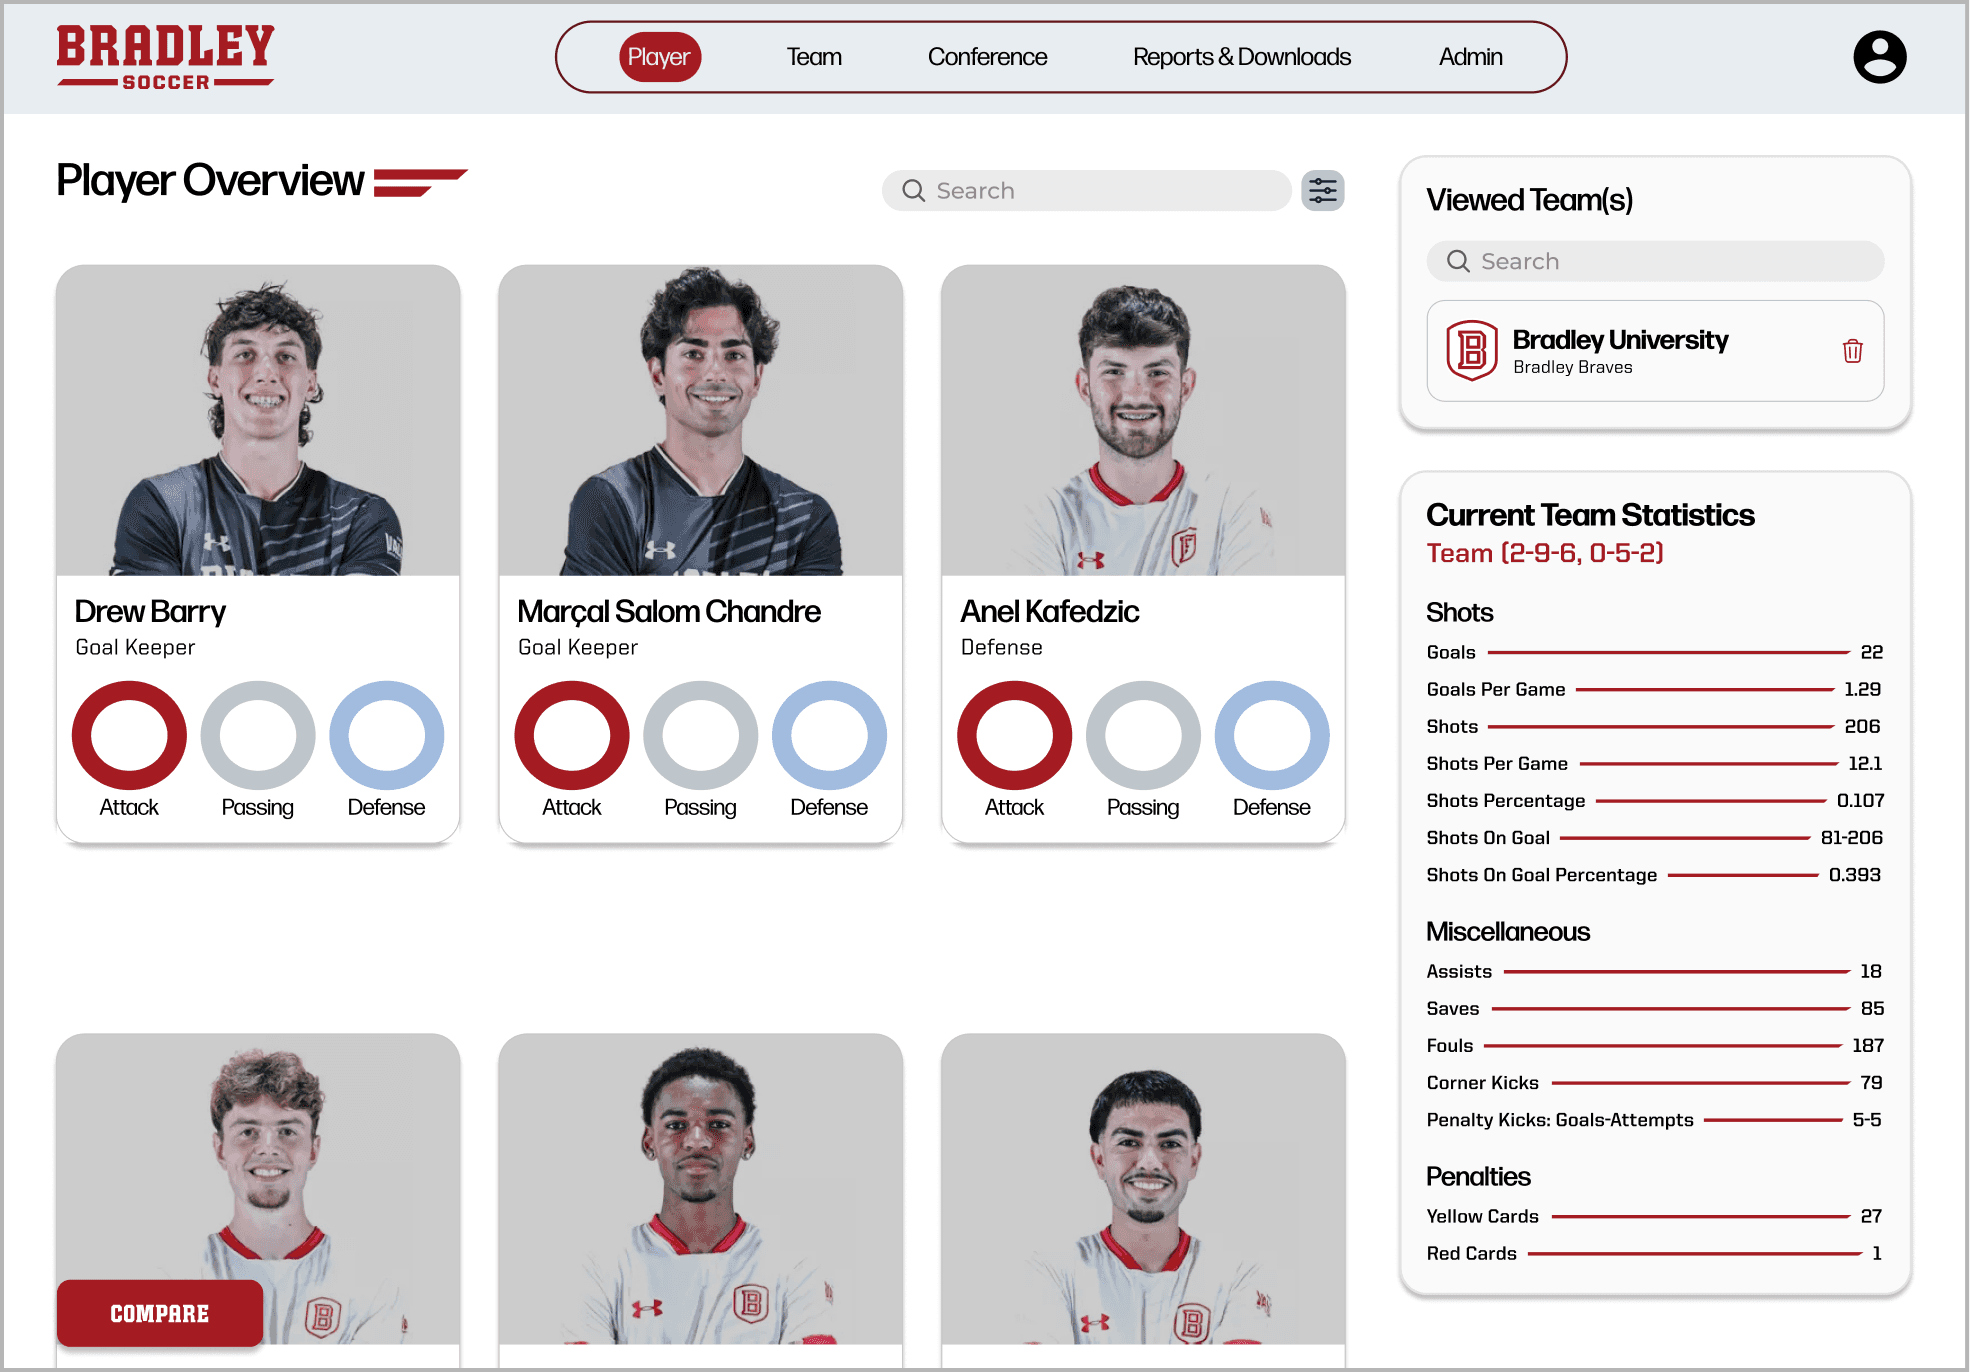
Card layout for quick player scanning
Stat rings show attack, passing, defense
Quick player comparisons on one page
Easily switch between conference teams
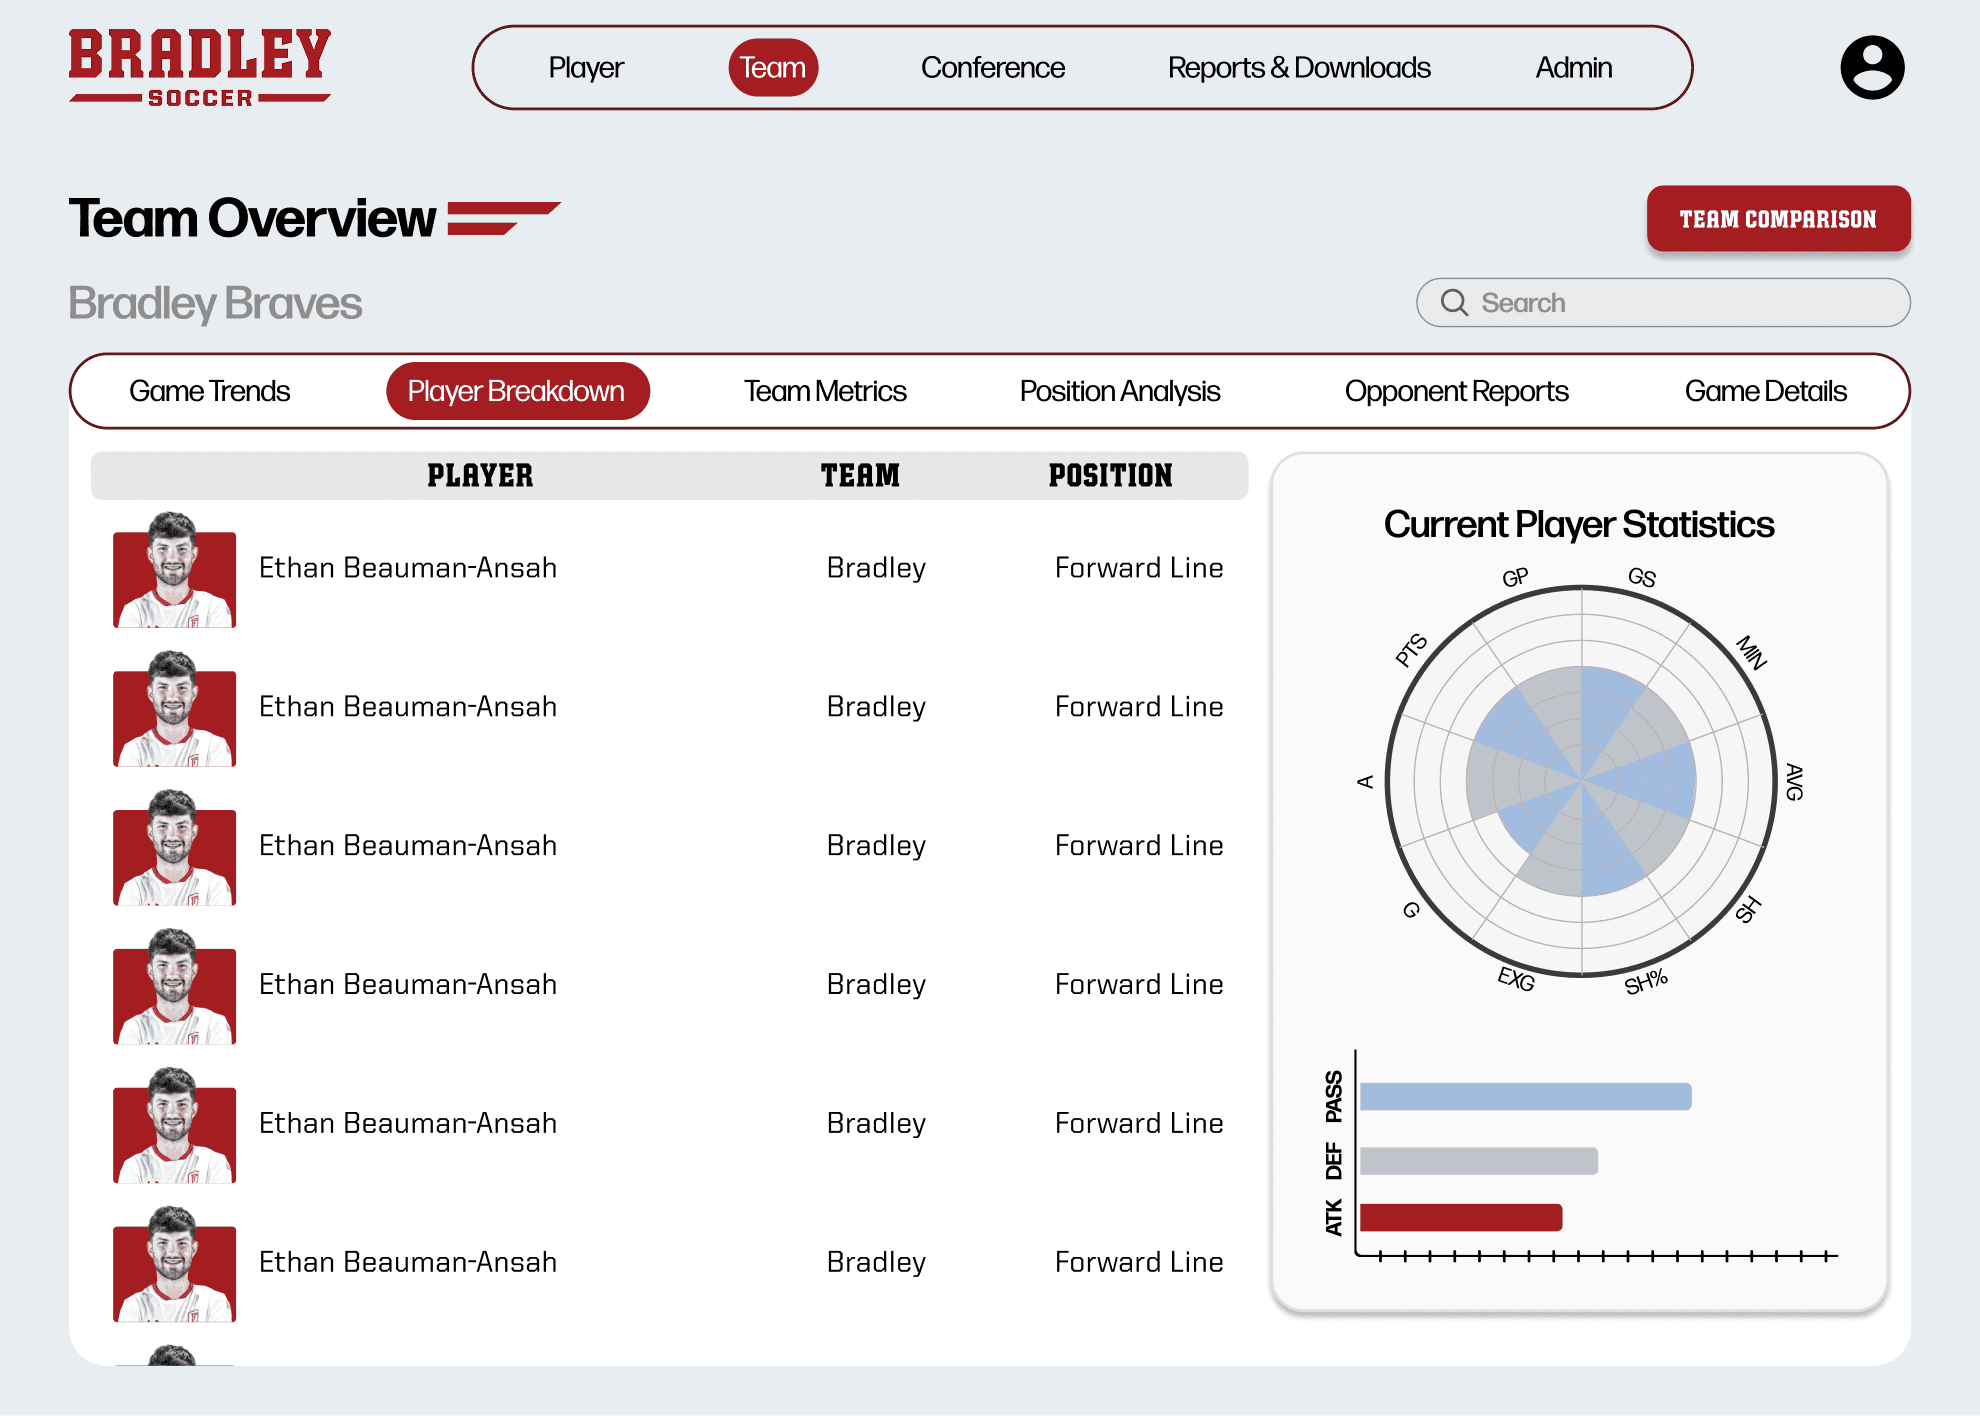
Team Overview -
Player Breakdown
Sortable table for side-by-side player comparison
Shows stats with position and team context
Sidebar charts break down player performance
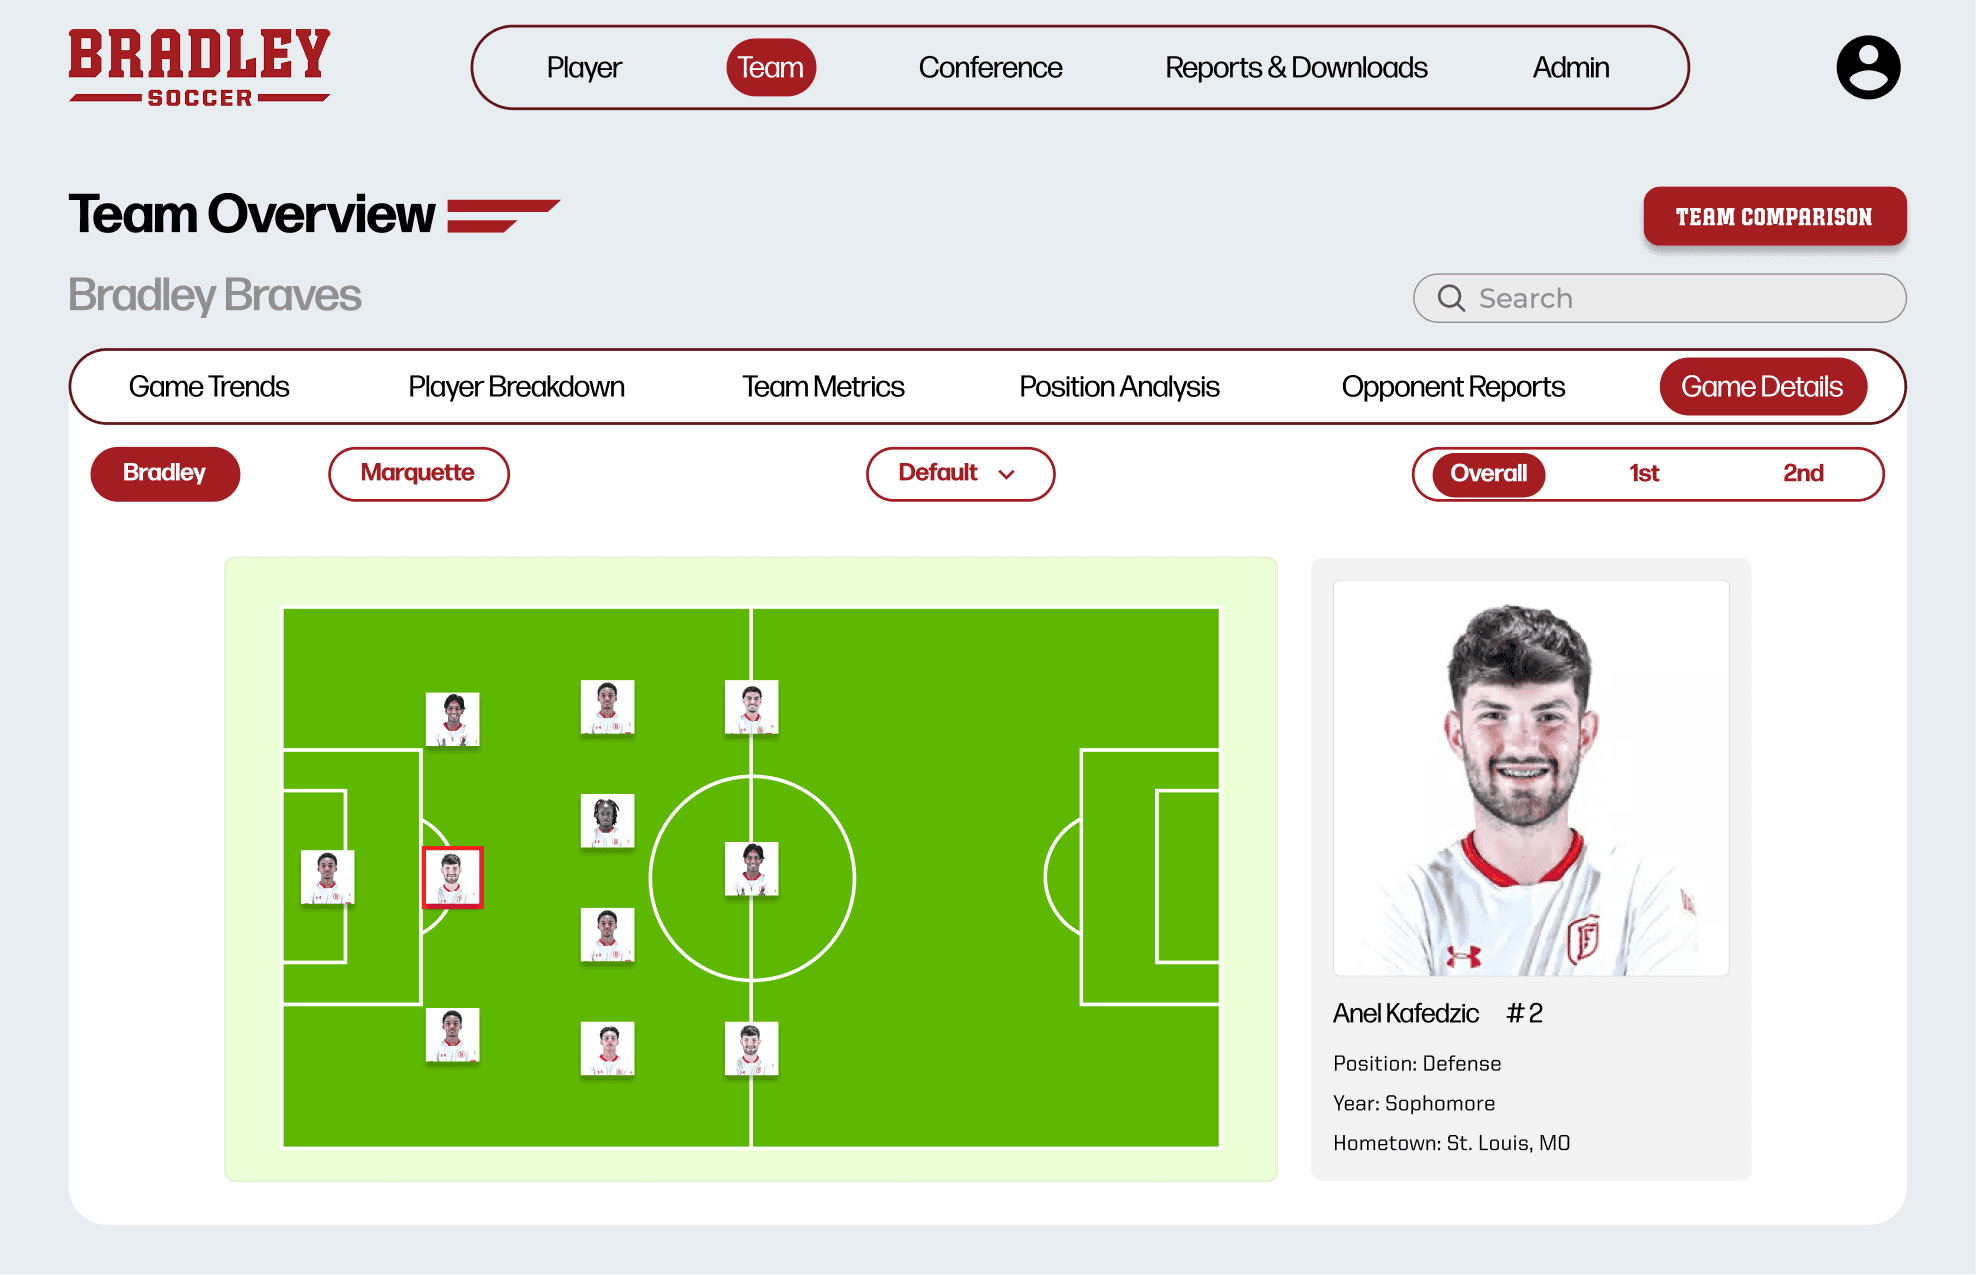
Team Overview -
Game Details
Page variants for different metrics (shots, possession, attack)
Visualizes on-field positioning
Filter views by halves or teams
Custom views for key performance data

Player
Team
Conference
Reports & Downloads
Admin
Team
Player
Admin
Conference
Reports & Downloads

50%
20%
60%
41%
80%
60%
30%
45%
77%
83%
Passes
Accurate Passes
Accurate Progressive Passes
Long Ball Ration
Fwd Ball Ration

Josh R.
Class: Sophomore
Height: 6’3
Weight: 195
Position: Center Back
Total
0
0
0
0
0
Goals
Category (Per 90 minutes)
Shots
Head Goals
Passes to final third
Passes to penalty area
Defending
Attacking
Possesion
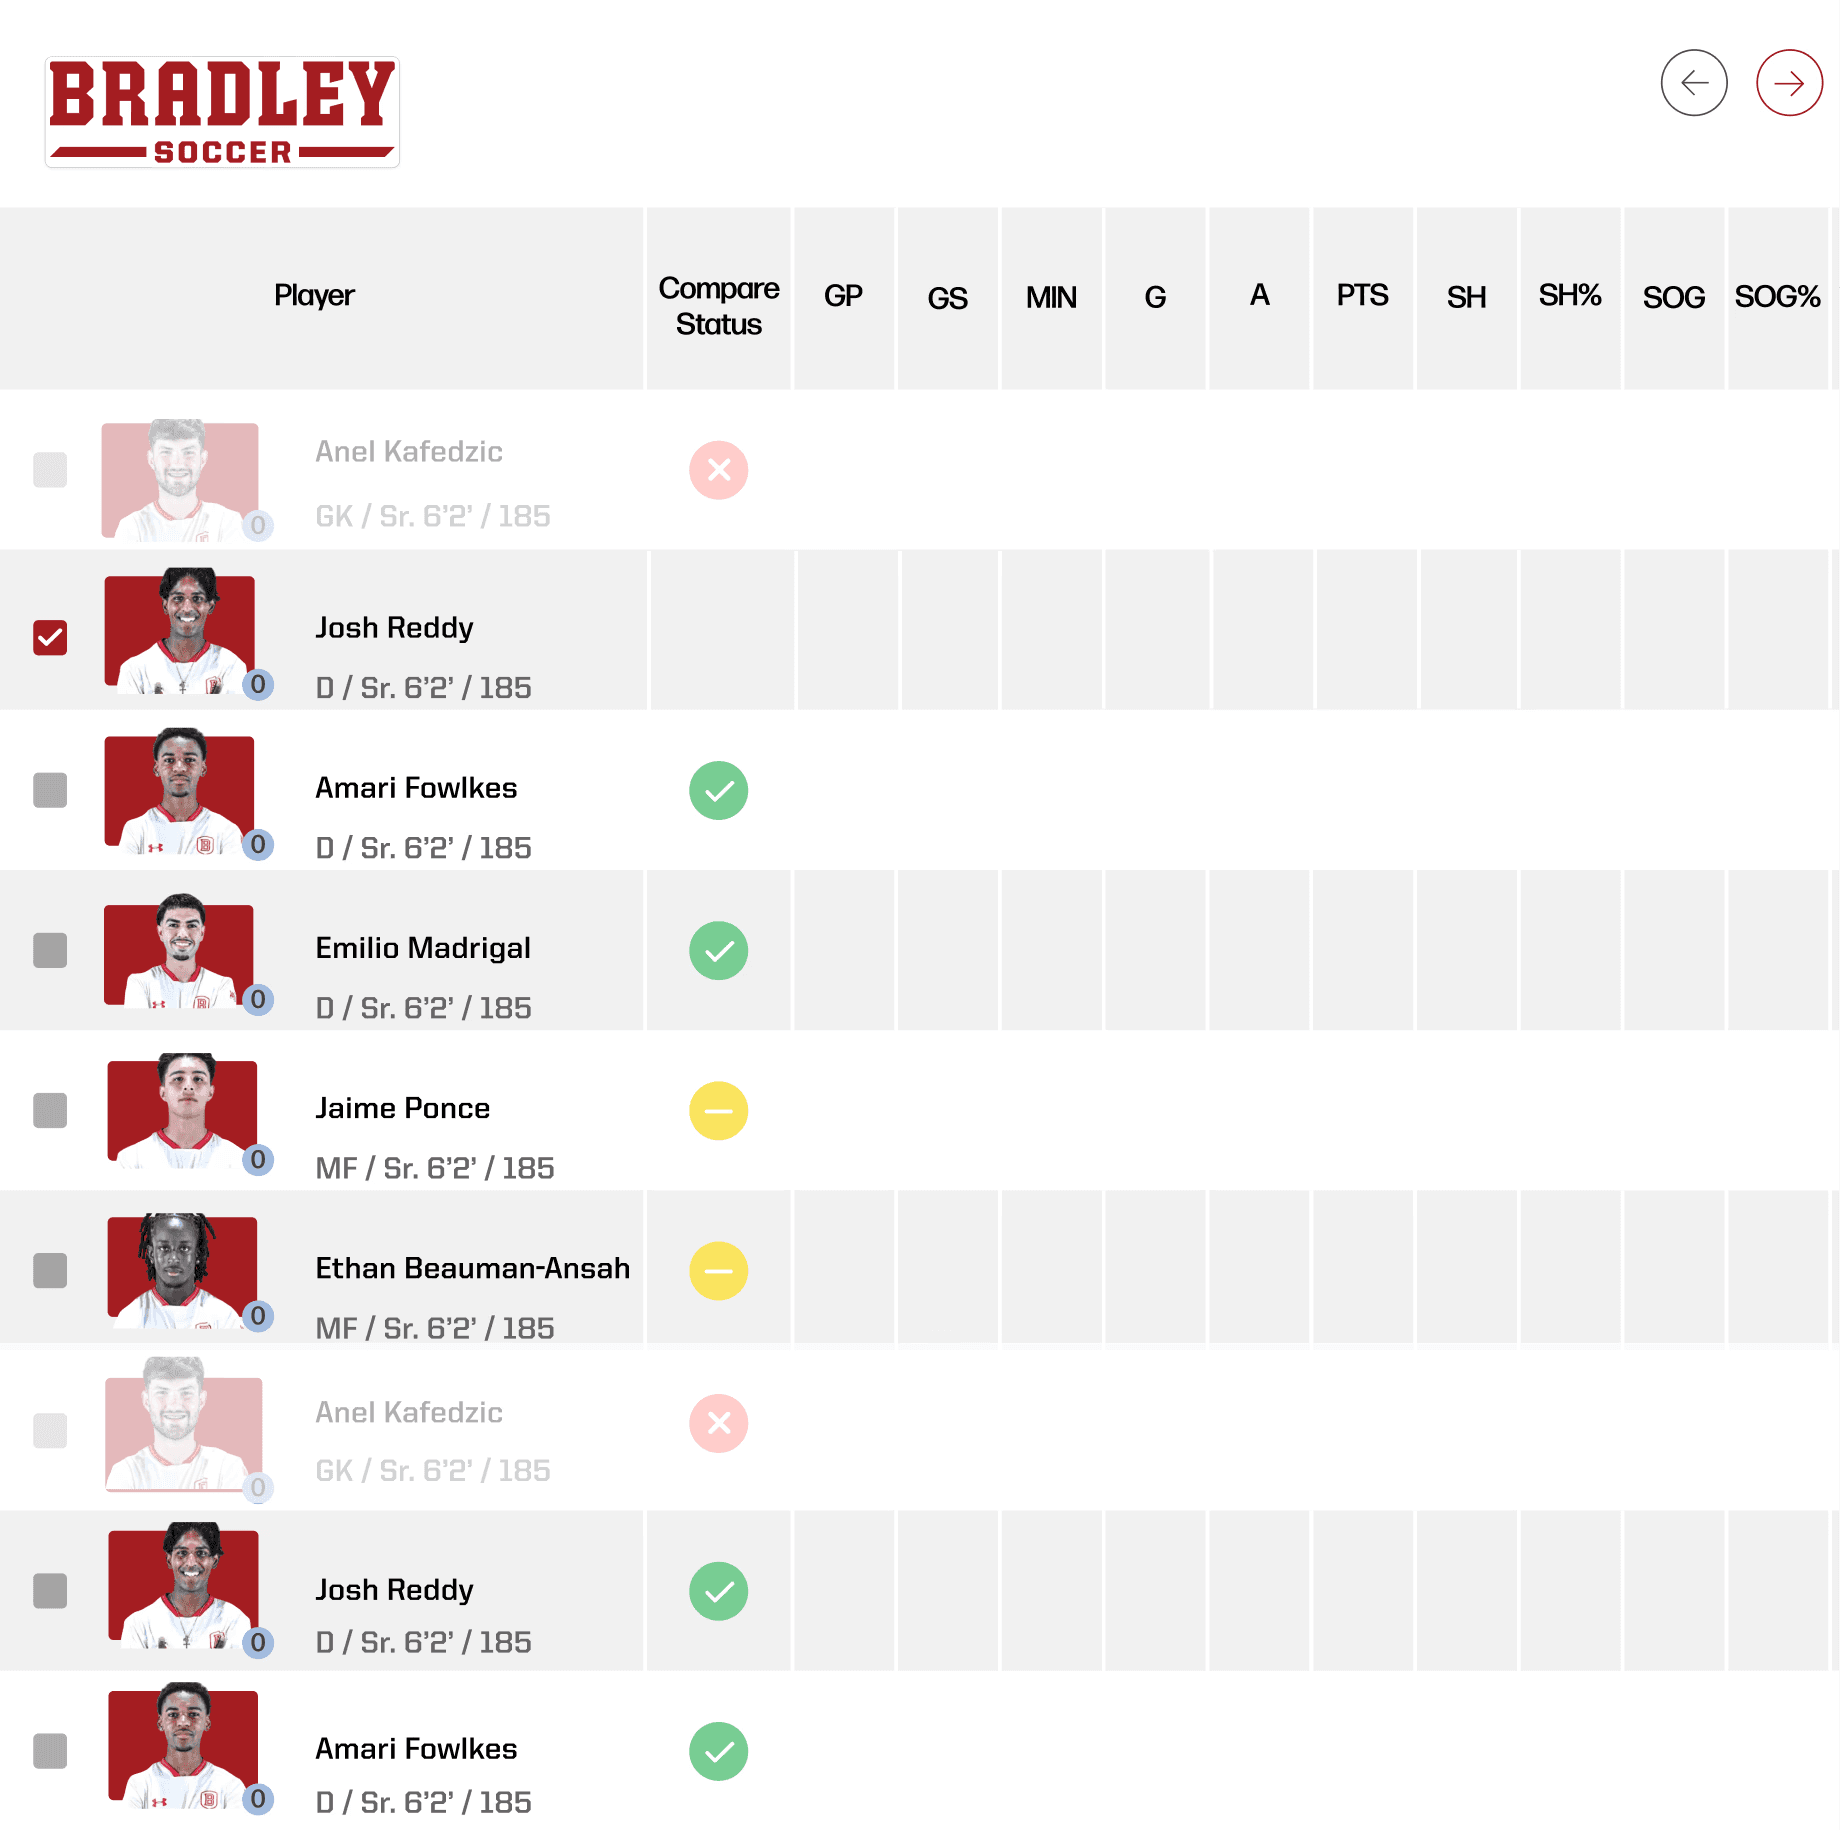
Player Compare
Fair, position based player comparison tool
Simplified radar chart for quick team insights
Identifies similar or complementary player profiles
Uses color and layering to reduce visual overload
Replaces multiple tables for easier comparison
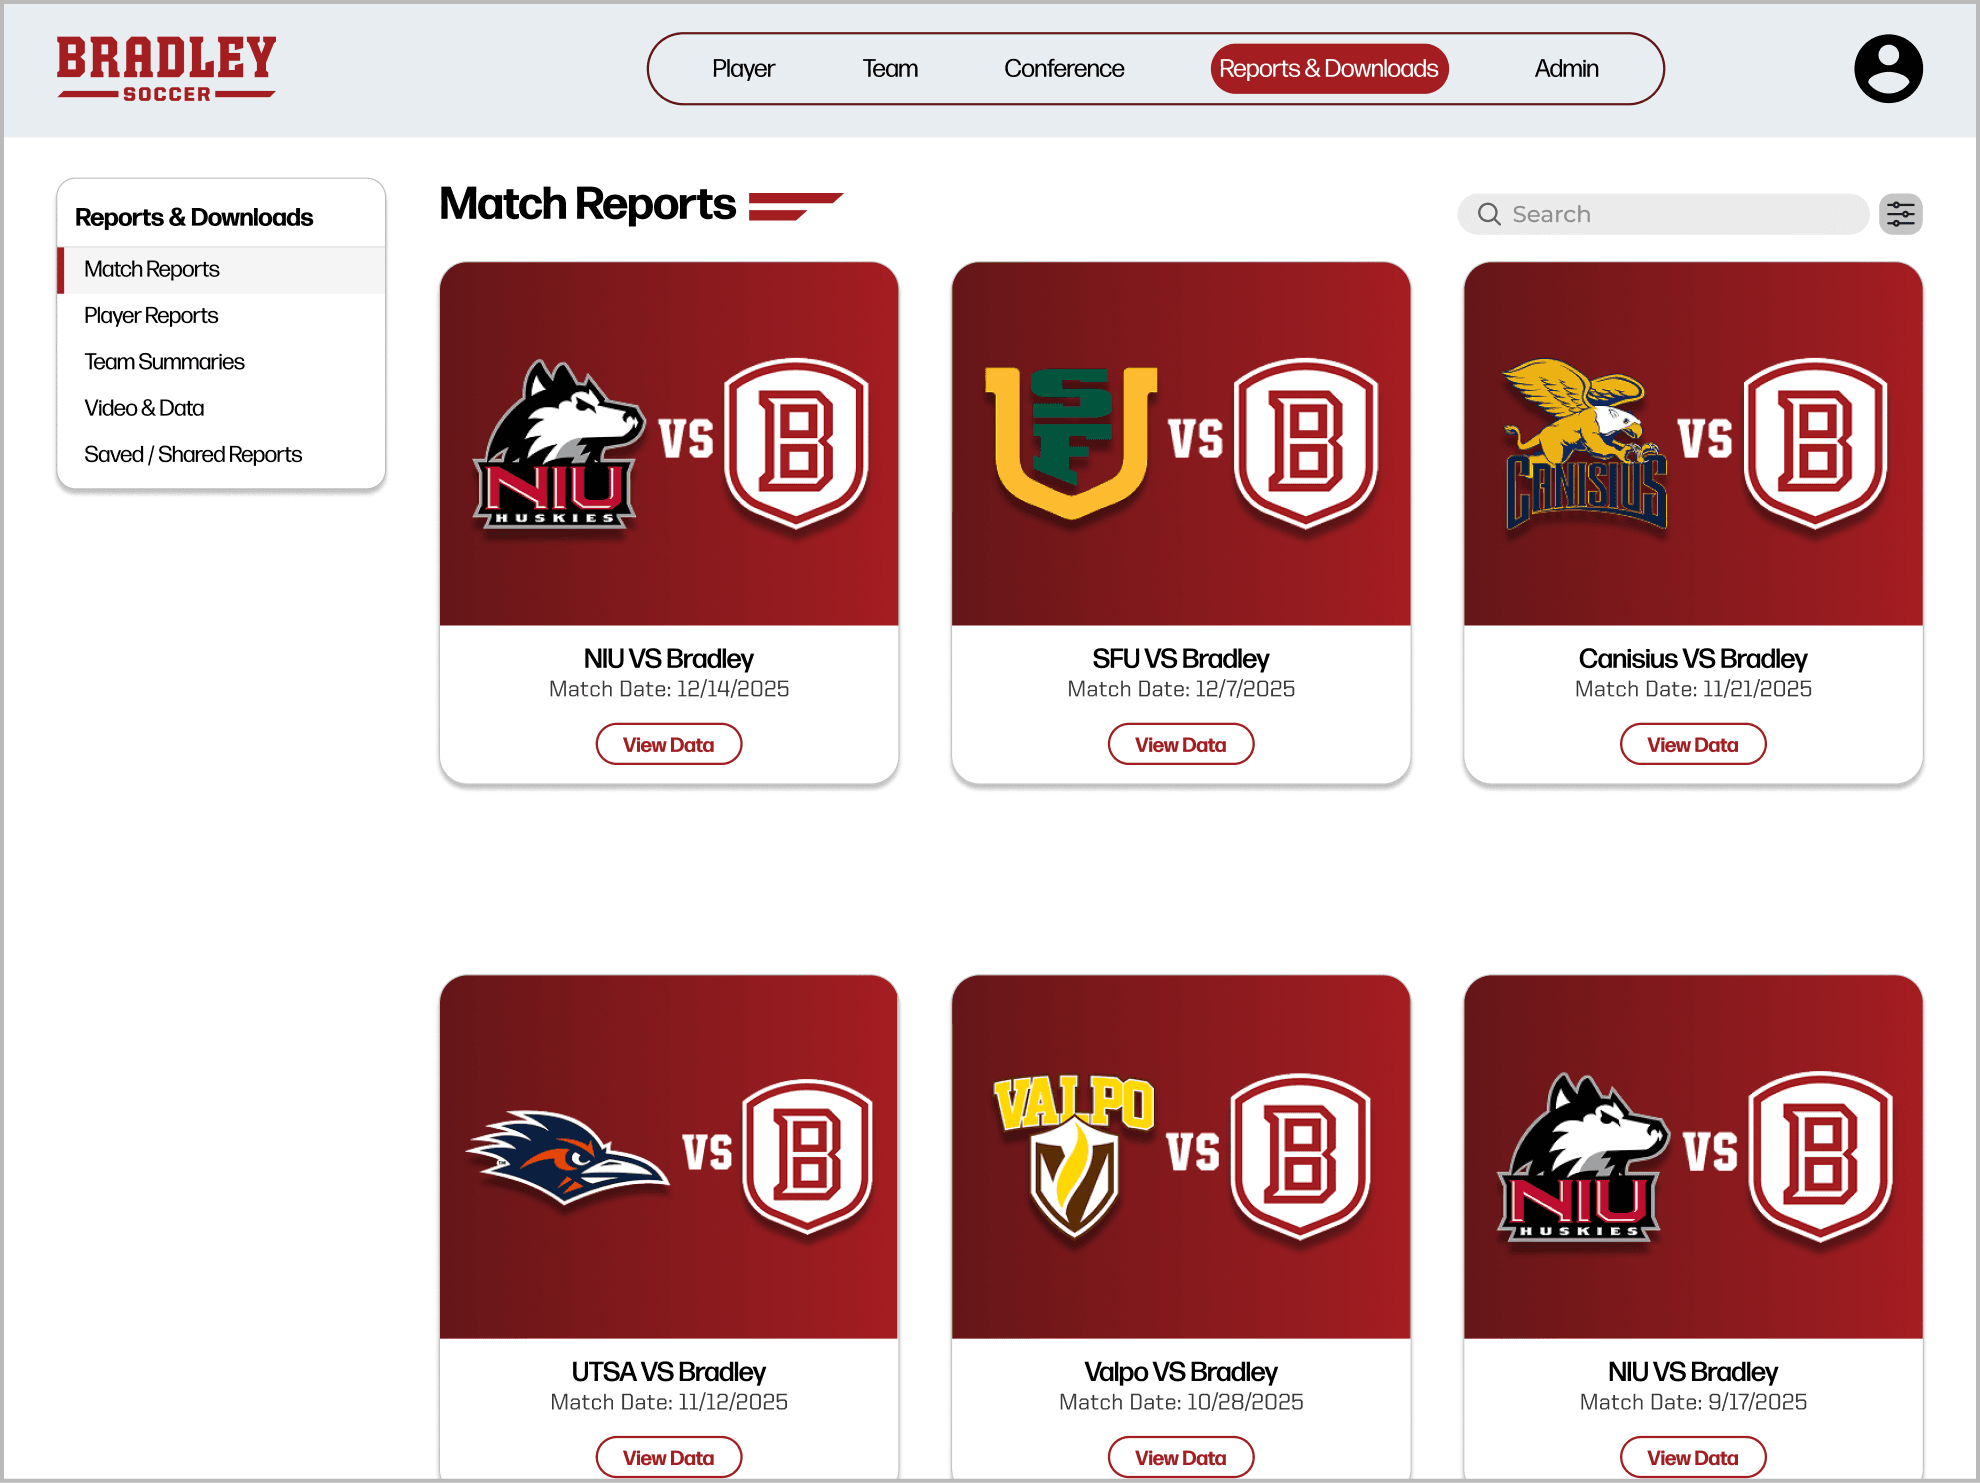
Match Reports
Match widgets link to past game data by team and date
Sidebar navigation for reports and easy downloads
Search and filter for quick team report access
Admin & Management
Easy data upload for coaches
Shows most recent uploads for quick reference
Confirms successful uploads with feedback message

Player
Team
Conference
Reports & Downloads
Admin
Upload Data
CONFIRM
3.93 MB
John Smith 81 min goal
3.16 GB
Bradley v. NIU Soccer.mov
Upload Data
Admin & Management
Upload Data
Validate Data
Manage Users & Roles
Integration Settings
System Logs / Status
Reports & Downloads
Match Reports
Player Reports
Team Summaries
Video & Data
Saved / Shared Reports
Recently Uploaded
John Smith Scores 81st min. mp4
Bradley v. NIU Soccer.mov
Tyrese Hal scores off Free-Kick (21st). mp4
04/31/26
04/31/26
04/31/26
File Name
Date
Link
Design

Micheal Vernes
31 years old
Bradley University’s D1 soccer team assistant coach
Peoria, IL
Played college soccer at Bradley
Joined Bradley’s Team as assistant coach after
his graduation
Assistant Coach
Loved watching soccer growing up
Played for Bradley from 2012-2015
After graduating, came back to be assistant coach
Hardworking, strategist, dedicated
Loves looking at and analyzing data
Very tech savvy who thrives on data
Bridges raw stats with strategy
Knows his players play-styles very well
Likes to bet on soccer games in free time
Bio

Goals
Easily show and interact with data
Leverage database to recruit players
Combined view of data and context (video)
The ability to easily insert player stats into new visualizations
More customizability
Easy to use, easily navigable, visualizations
Use analytics to identify player strengths/weaknesses
Optimize recruitment
Frustrations
Too many clicks to get where you need
PDF reports have raw stats but no context
video has context but no easy data links
Too much data
No context for data
Errors occur with too much data
Analysis paralysis
Likes
Easily compare one point of data to another
Customizability of data visualizations
Being able to search for data points he is looking for
FIFA stats
Python
Trend analysis
Dislikes
Data that is hard to read
Data points that are hard to understand
Visualizations that make it difficult to find what you are looking for
Manual Data entry


Previous Game
Button
Button
Bradley vs. Opponent
4 - 2
Saturday, Oct 18
Home Game
Shots on target
Shots off target
Name
Position
Number
type of shot/defense/attack/ etc.
Lorum
Ipsum
vs.
1 - 4
X/X/XXXX
1st
2nd
Defense
Attack
Possesion
Reset
Shots
61%
39%
Shots on target
Shots off target
T
L
SV%
GP
MIn
GA
GA/AVG
SV
W
SHO
Total
45
3961:13
71
1.61
187
0.725
10
21
12
9
640
GP-17
MIN-1530.00
GA-37
GA/AVG-2.13
SV-84
SV%-0.694
W-2
L-9
T-6
SHO-9
SF-274